
Control Panels (CP)
At a Glance
Section titled “At a Glance”
- Category: Monitoring & Analytics
- Primary environment: MaaS Consumer, MaaS Provider
- Documentation focus: Design reference
- Maturity: TRL 4–5 (first release, reported in D10.1 at M20; MaaSAI System 1st Release planned for M24)
- Related architecture docs: Reference Architecture Guide, Environments
Purpose
Section titled “Purpose”The Control Panels (CP) component allows users to collect both batch and real-time streaming data to create visualizations, dashboards, live alerts, and reports. This gives users access to real-time insights and alerts on production processes. CP is composed of the internal components listed below.
Primary Actors
Section titled “Primary Actors”The D5.2 usage viewpoint defines roles, permissions, constraints, a role-task matrix, and a use case diagram for this solution.
- User: Can access and view the simple dashboards created.; constraint: Can only view the available dashboards
- Dashboard Creator: Responsible for enabling the rest of the processes through data collection and analysis, managing the core data infrastructure, building dashboards and reporting and carrying out extensive data analysis.; constraint: Can create, view, edit and delete dashboards
- System Administrator: Manages the system and all its components, from the system itself to the users registered in it.
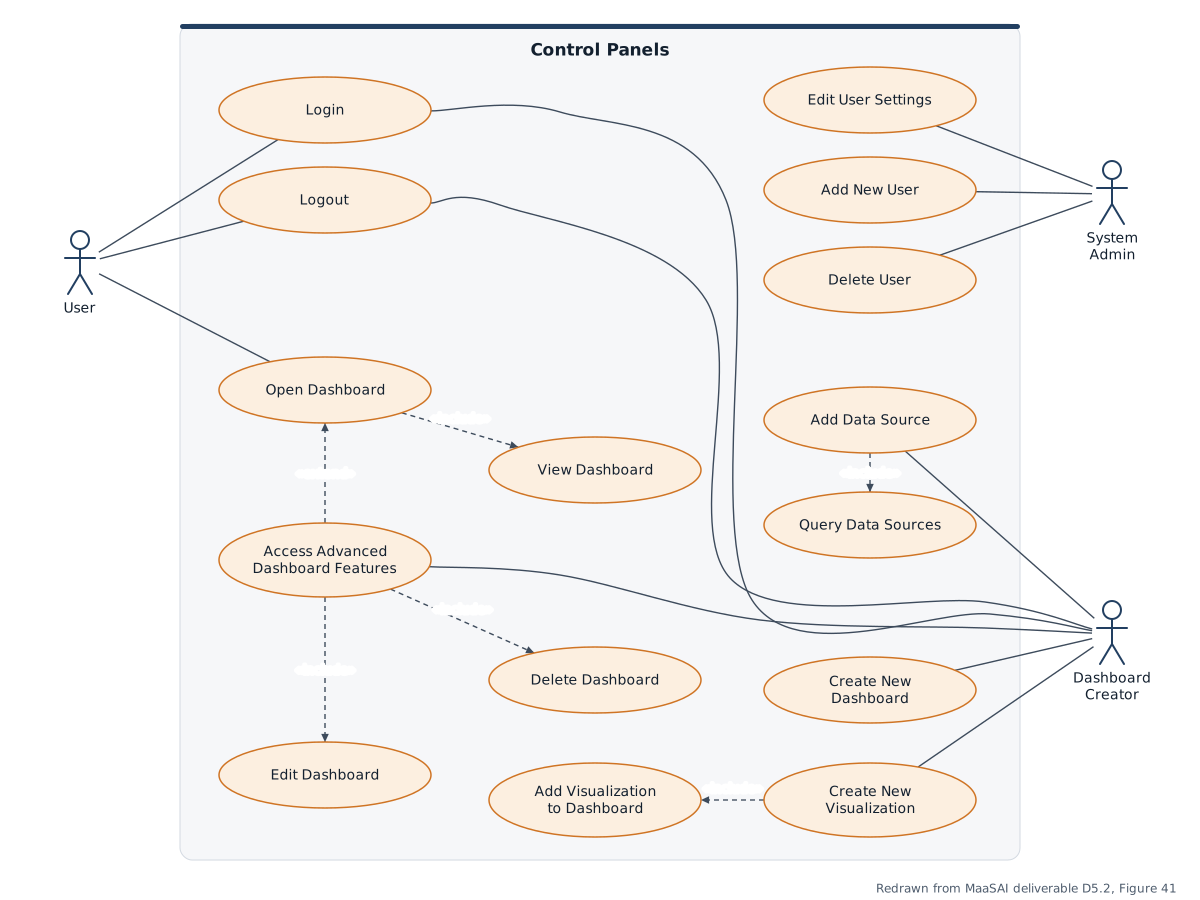
Use-case diagram redrawn from MaaSAI deliverable D5.2.
Functional Components
Section titled “Functional Components”CP is structured around authentication, dashboard composition, visualisation management, and data-source querying services. The functional diagram shows how operational users and administrators create dashboards, attach data sources, and publish monitoring views for industrial supervision.
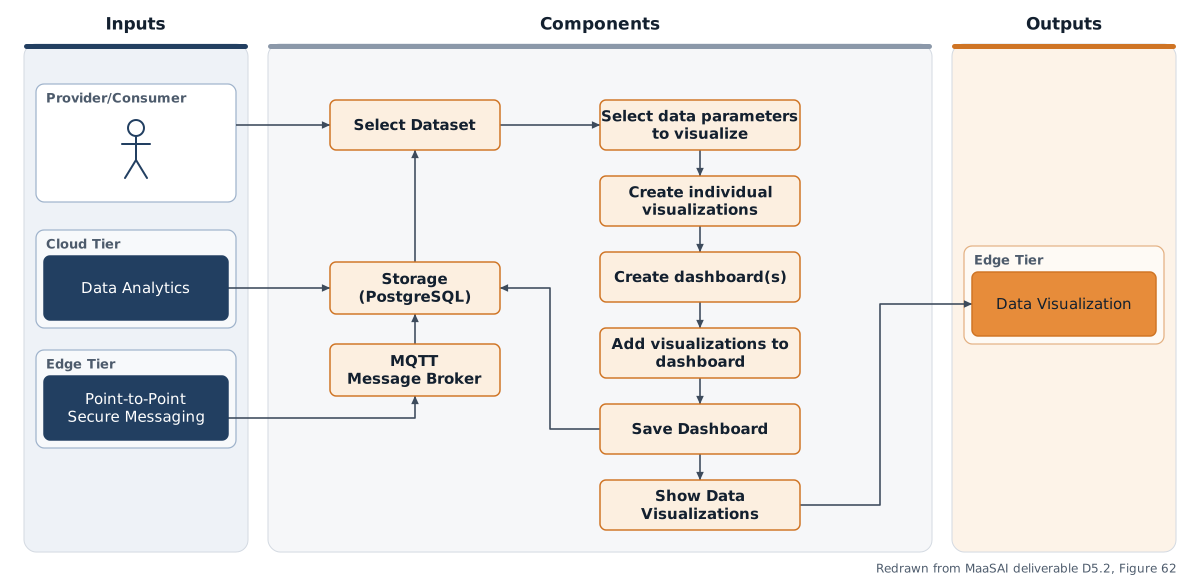
Functional components diagram redrawn from MaaSAI deliverable D5.2.
Design Baseline
Section titled “Design Baseline”• Data Visualization Engine: The primary component of the solution, it offers the functionalities to perform SQL queries on the datasets, creating visualizations from the datasets or the SQL queries, and creating Dashboards to integrate the created visualizations. It also functions as the user interface of the solution and allows the user to display the created Dashboards and Visualizations.
• Backend: The interface responsible for exchanging data between the Storage and the MQTT Message Broker.
• Storage: The component responsible for the storage of all the data, be it MQTT messages, batch data from files uploaded to the Data Visualization Engine, created Views using SQL queries, Visualizations and Dashboards.
The CP system architecture features a modular containerized approach, which facilitates the scalability and deployment of the solution. The system is divided into the following components:
Data Visualization Engine: The primary component of the solution is containerized and accesses the storage through a direct connection to the database using a connection string or a URL. It is stateless, as all the data is stored in the Storage component.
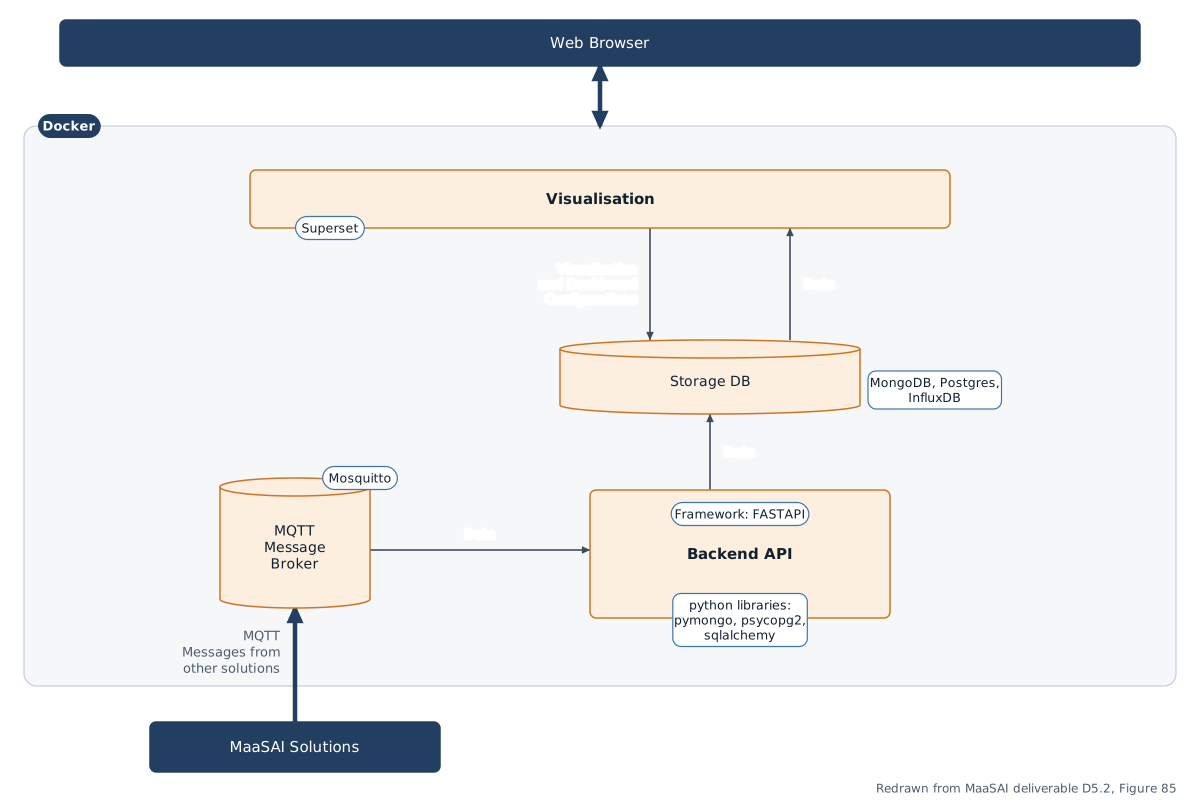
Architecture diagram redrawn from MaaSAI deliverable D5.2.
Technology Stack
Section titled “Technology Stack”CP is assembled from established open-source data technologies, deployed as a set of containerised services.
| Category | Technology |
|---|---|
| Data ingestion | Telegraf 1.38, connecting to relational databases, MQTT brokers, and other sources |
| Internal database | InfluxDB 3-core |
| Alerts & reporting engine | InfluxDB Processing Engine (integrated in InfluxDB) |
| Data visualisation engine | Apache Superset 5.0 |
| Containerisation | Docker / Docker Compose |
| Licence | no licence file is currently included in the repository; the underlying technologies use the Apache License 2.0 and/or MIT licence |
Integrations & External Dependencies
Section titled “Integrations & External Dependencies”Within the MaaSAI architecture, CP acts as a visualisation layer that surfaces process-level data as well as higher-level interactions between MaaS Consumer and Provider agents and Cloud MaaS Marketplace metrics, serving both consumers and providers. On the data side, Telegraf allows the ingestion of both batch and streaming data from relational databases and MQTT brokers. The only external dependency declared in D10.1 is NodeJS, required to build the Superset frontend component.
APIs & Interfaces
Section titled “APIs & Interfaces”CP exposes REST APIs from its InfluxDB and Superset components.
- Database management:
/api/v3/configure/database— list, create, update, and delete databases - Data query:
/api/v3/query_influxqland/api/v3/query_sql— retrieve data via InfluxQL or SQL - Data write:
/api/v3/write_lp— write data through InfluxDB’s line protocol - Charts:
/api/v1/chart/— create, list, update, and delete charts - Dashboards:
/api/v1/dashboard/— create, list, update, and delete dashboards
The user interface comprises an alerts manager (based on the InfluxDB explorer UI, where anomaly-detection plugins are managed), a query tool for filtering data and creating temporary views, a visualisation creation environment, and an interactive dashboard builder with global filters.
User Interface
Section titled “User Interface”Representative screens of the CP web interface in the first release:
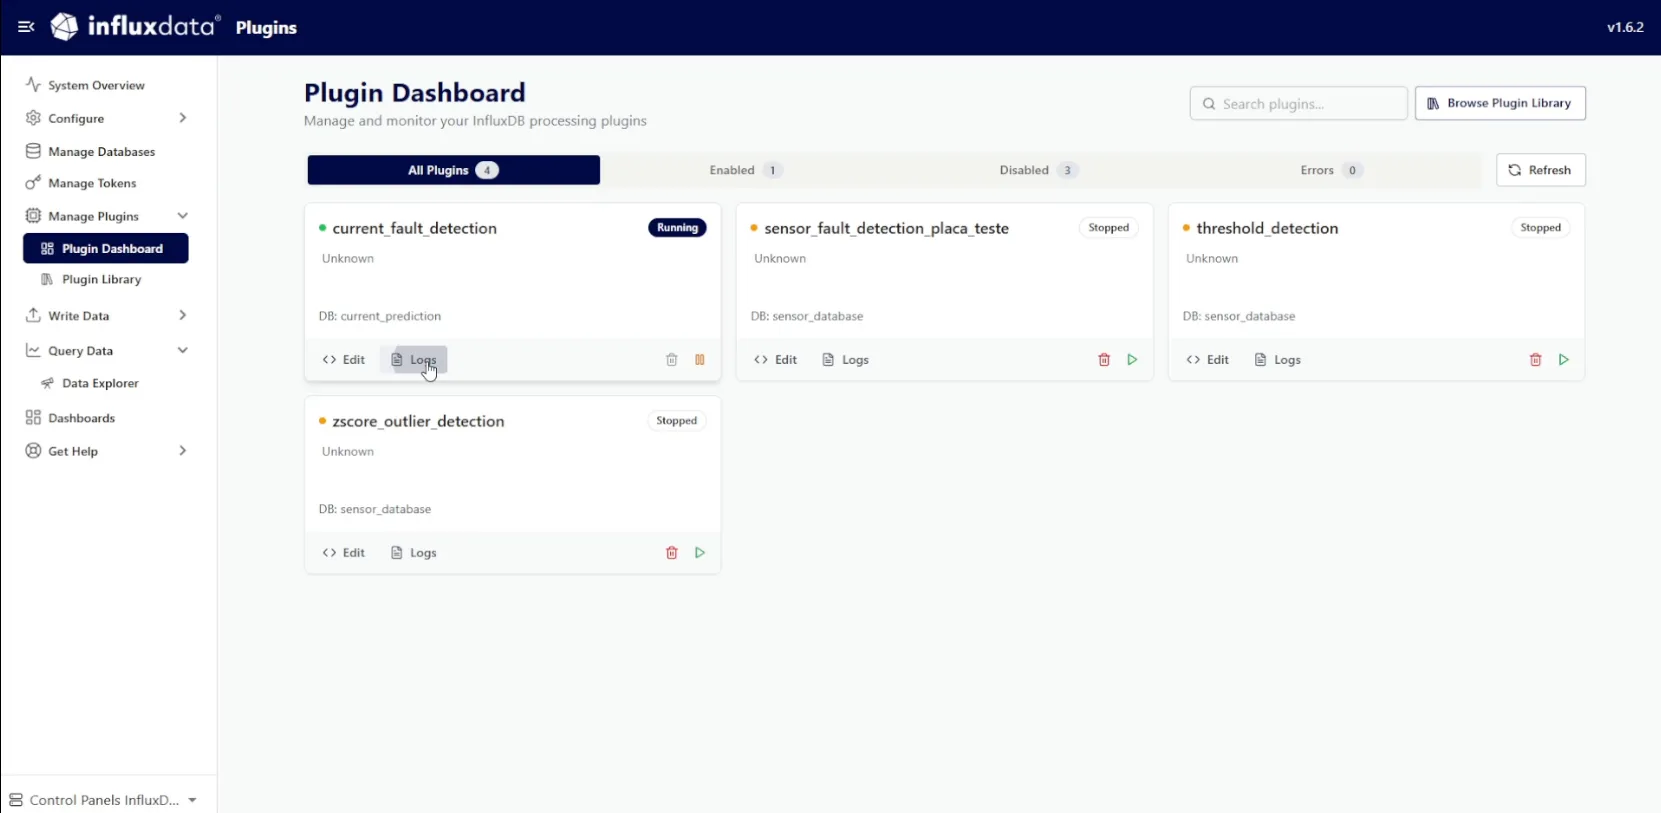
Control Panels alerts manager — MaaSAI deliverable D10.1.
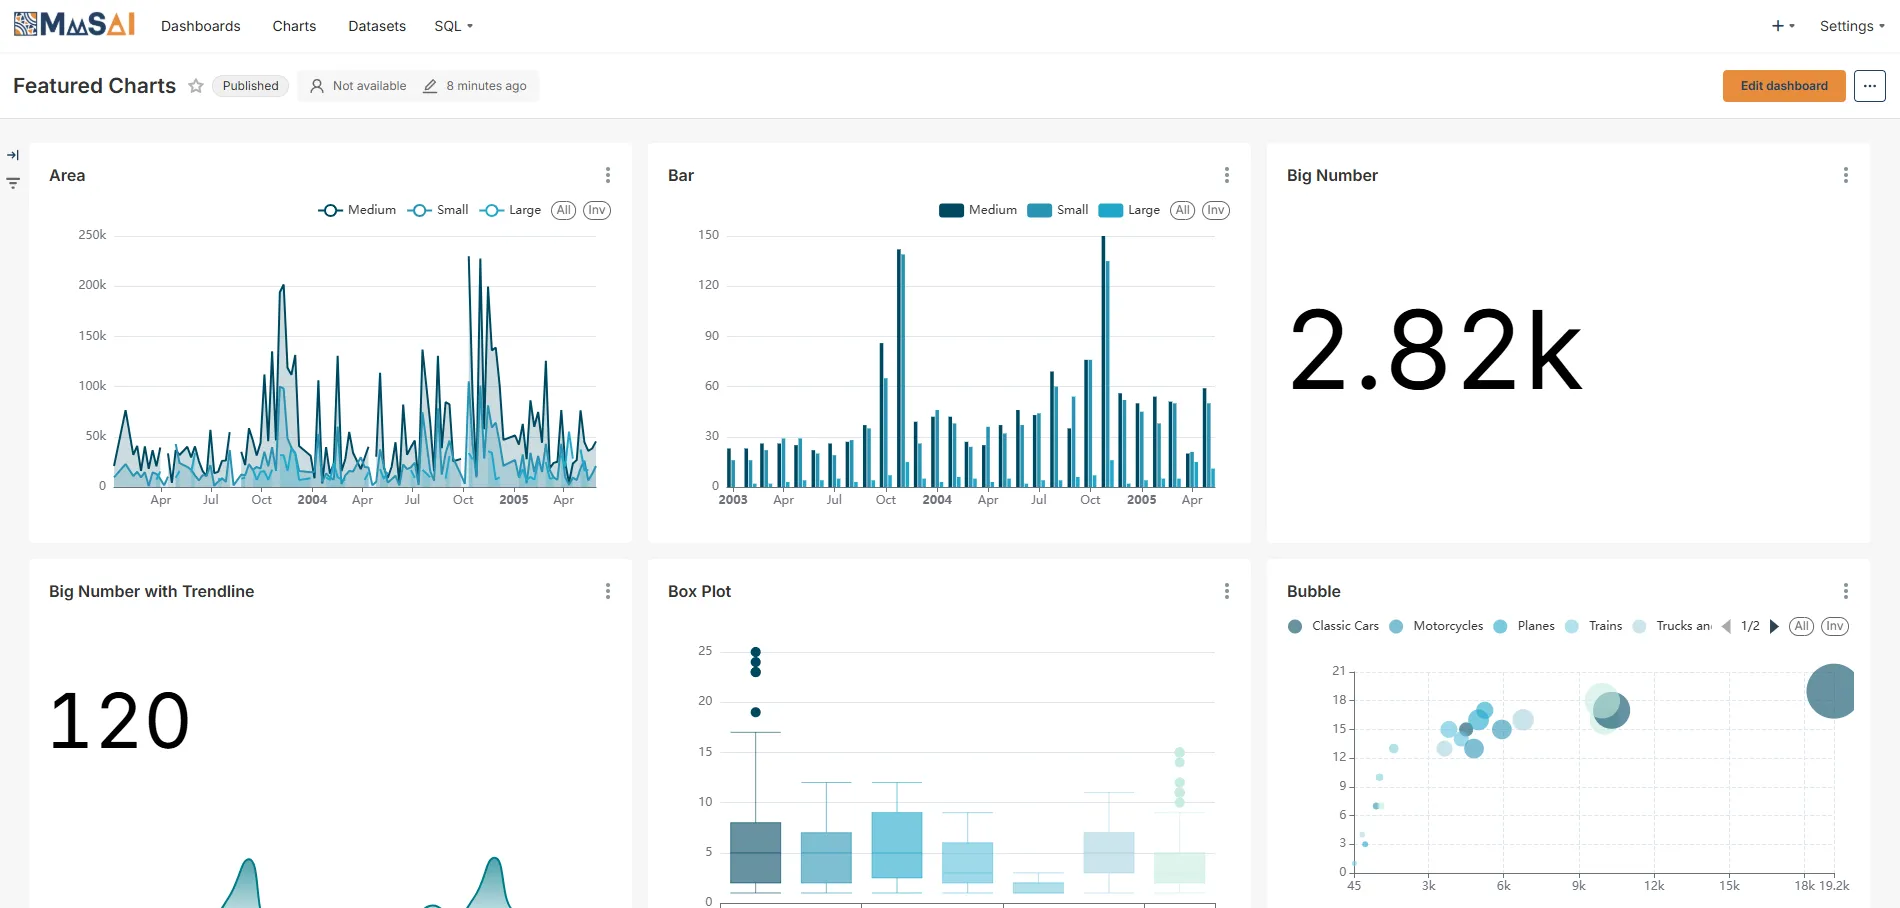
Control Panels dashboard — MaaSAI deliverable D10.1.
Deployment & Configuration
Section titled “Deployment & Configuration”CP is distributed as a pre-configured set of containers launched with a single Docker Compose command, with one combined production/development profile (docker-compose.yml), using Docker Engine 29.1.3 and Compose v2.
| Requirement | Minimum | Recommended |
|---|---|---|
| CPU | 2 vCPUs | 4+ vCPUs |
| RAM | 8 GB | 16 GB |
| Storage | 20 GB | 50–100 GB |
| OS | Any Docker-capable OS | 64-bit Linux |
Data-source connections are currently configured manually through environment files, pending a dedicated configuration UI.