
Predictive Maintenance Toolkit (PMT)
At a Glance
Section titled “At a Glance”
- Category: Planning, Design & Assessment
- Primary environment: MaaS Provider
- Documentation focus: Design reference
- Maturity: TRL 3 (first release, reported in D12.1 at M20; MaaSAI System 1st Release planned for M24)
- Related architecture docs: Reference Architecture Guide, Environments
Purpose
Section titled “Purpose”The Predictive Maintenance Toolkit (PMT) is conceived as a modular solution that empowers MaaS Providers to anticipate equipment failures and optimize maintenance schedules. Its architecture is structured into four main functional layers, each responsible for a key part of the predictive maintenance workflow. Together, these layers ensure seamless data integration, intelligent analysis and actionable outputs within the MaaSAI ecosystem.
Primary Actors
Section titled “Primary Actors”The D5.2 usage viewpoint defines roles, permissions, constraints, a role-task matrix, and a use case diagram for this solution.
- Maintenance technician: Executing maintenance tasks generated by the toolkit. Report results of maintenance activities performed.; constraint: Cannot modify toolkit settings or schedule new maintenance activities. Only allowed to check information and update activities status.
- Maintenance manager: Check manufacturing resources status and analyze alerts and maintenance activities generated by the system, accepting or dismissing them based on his criteria; constraint: Cannot manage users, add or delete manufacturing resources monitored. Cannot change technical settings of the toolkit.
- System administrator: Manage the toolkit and supporting components. Manufacturing resource data integration configuration (connections with MES/ERP or sensors) Keep up to date manufacturing resource monitored. Manage users lists and roles. Ensure proper functioning of the toolkit; constraint: May or may not take part in daily monitoring of maintenance activities. Has no particular constraints
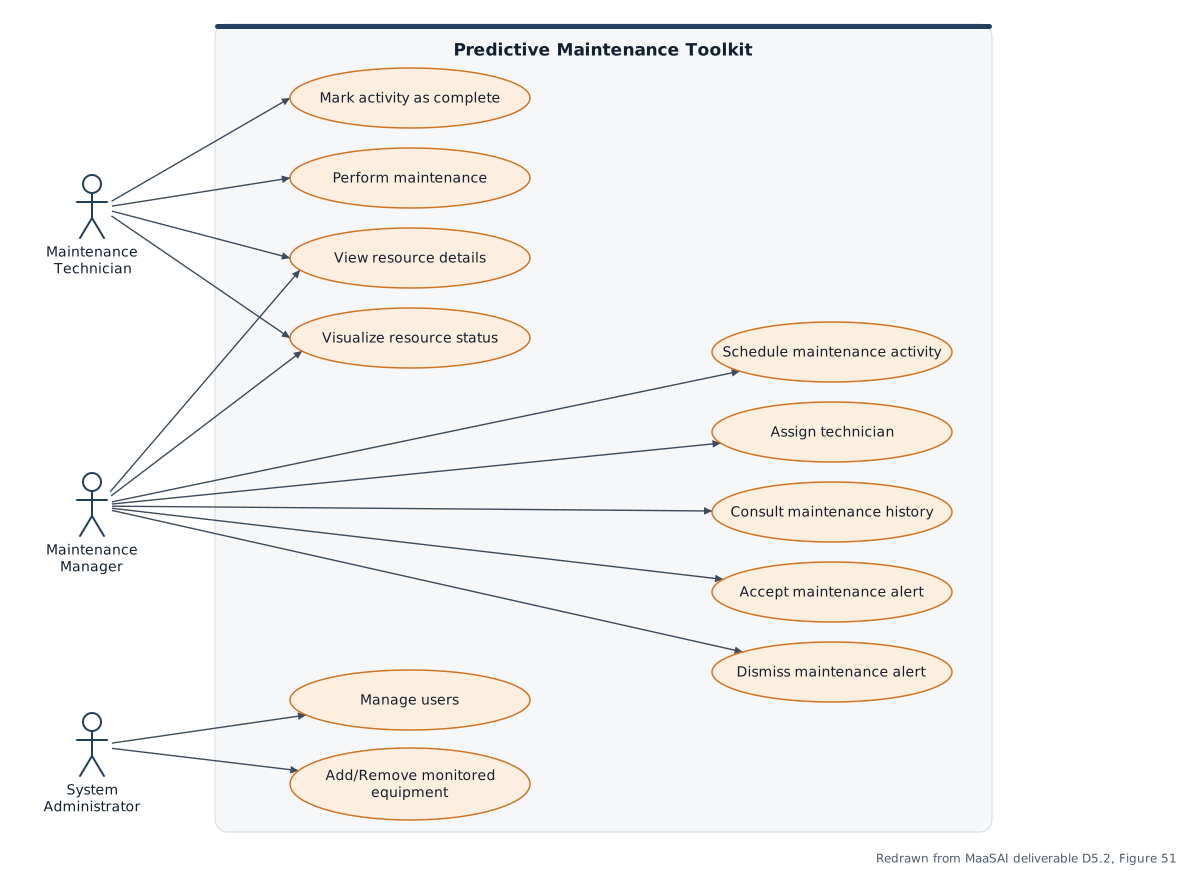
Use-case diagram redrawn from MaaSAI deliverable D5.2.
Functional Components
Section titled “Functional Components”PMT combines data integration, preprocessing, predictive models, dashboards, and a knowledge base to support condition monitoring and maintenance decisions. The functional view shows how raw operational data becomes predictions, dashboards, and maintenance-oriented insights.
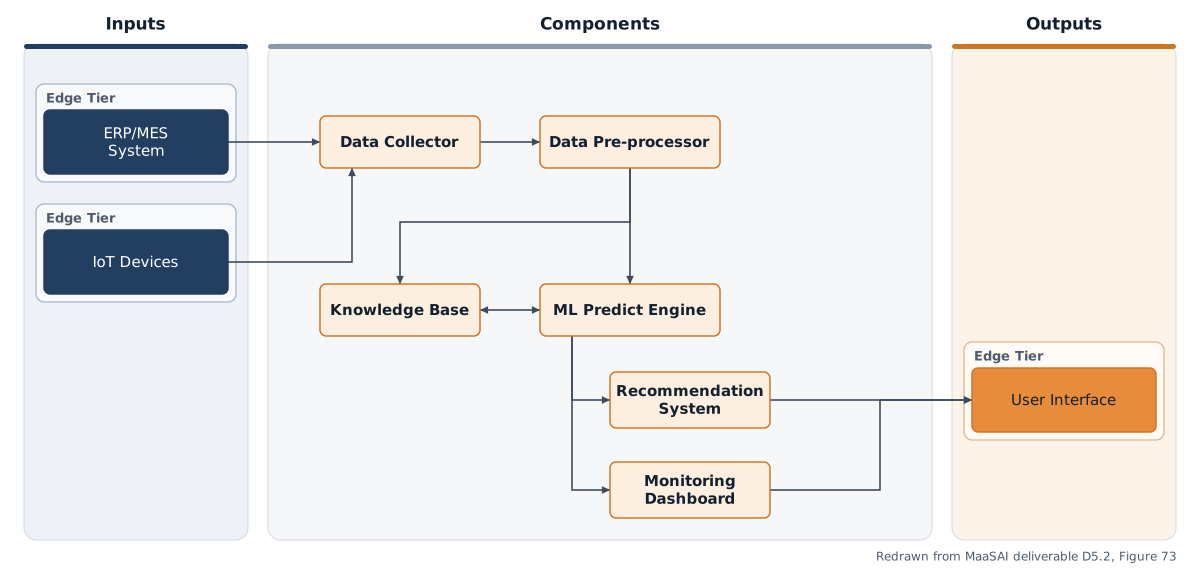
Functional components diagram redrawn from MaaSAI deliverable D5.2.
Design Baseline
Section titled “Design Baseline”The Data Integration and the Data Pre-processor implemented using Node-RED as the enabling technology. This module connects to ERP/MES systems and IoT devices, standardizing diverse input formats and applying necessary preprocessing steps such as cleaning, filtering and normalization. By centralizing integration and transformation in low-code environment, this layer provides flexibility and simplifies adaptation to different provider infrastructures.
The processed data flows into the Knowledge Base, which acts as the persistent storage hub of the PMT. Here, both historical information (maintenance records, equipment usage patterns, failure logs…) and current operational data are stored. This ensures that predictive models have access to long-term trends while enabling traceability and explainability of AI outputs.
On top of this, the ML Prediction Engine leverages both Knowledge and real-time data streams to identify anomalies, detect early failure signals and estimate the optimal timing for interventions. The engine combines machine learning with explainable AI (xAI), ensuing that predictions are not only accurate but also justifiable. This strengthens user trust by providing understandable reasons behind each recommendation.
The Predictive Maintenance Toolkit (PMT) employs a modular, containerised architecture designed to support MaaS Providers in anticipating equipment failures and optimising maintenance schedules. Its core components mirror the layered approach shown in the diagram: the Data Integration & Pre-process Layer, implemented with Node-RED, ingests raw data from MES, PLCs, and IoT sensors, applying cleaning and normalisation before storing it in the Knowledge Base (MongoDB and SQL). The ML Prediction Engine, built with Python, TensorFlow, scikit-learn, and exposed via FastAPI, leverages historical and real-time data to detect anomalies, predict failures, and estimate optimal intervention times. Explainable AI techniques such as SHAP and LIME ensure transparency in predictions. Finally, the Recommendation & Dashboard Layer, powered by Grafana, translates insights into actionable maintenance plans and intuitive visualisations for the user. All components are deployed in Docker containers, enabling flexible scaling and seamless integration with provider-side systems while maintaining interoperability within the MaaSAI ecosystem.
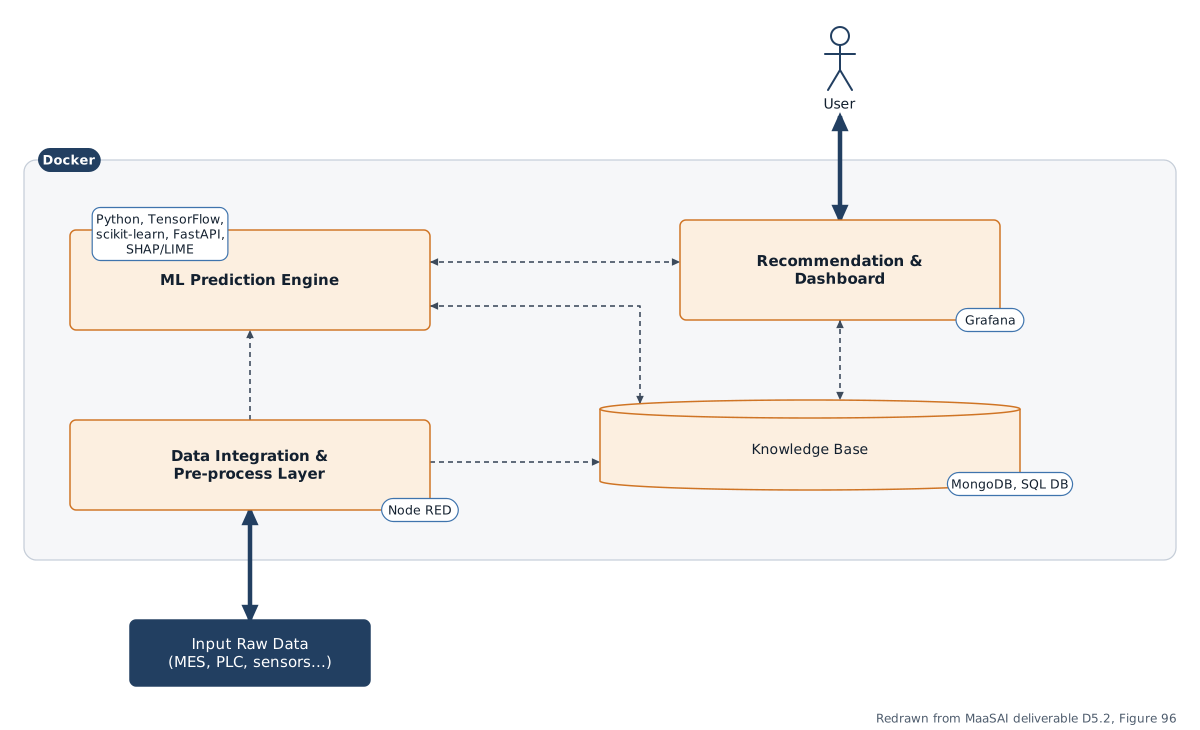
Architecture diagram redrawn from MaaSAI deliverable D5.2.
Technology Stack
Section titled “Technology Stack”The first release of the PMT is organised into backend, AI, frontend, database and ingestion layers.
| Category | Technology |
|---|---|
| Backend | Python (> 3.9) with FastAPI and the Uvicorn ASGI server; SQLAlchemy as ORM and Pydantic for data validation and configuration. |
| AI/Forecasting | the TiRex time-series transformer (tirex-ts), a zero-shot forecasting model running on PyTorch, with Pandas and NumPy for cleaning, formatting and indexing time-series data. |
| Frontend | React on the MaaSAI UI template, with Apache ECharts for graphs and Axios for asynchronous API requests. |
| Data | TimescaleDB time-series database. |
| Ingestion | Node-RED microservice acting as data collector and pre-processor. |
| Containerisation | Docker for all services. |
Integrations & External Dependencies
Section titled “Integrations & External Dependencies”The PMT has few external dependencies: only Docker (container runtime) and Keycloak (identity and access management) are required. Integration with the EDGE Data Storage (DS) — reading registered machines, machine status and production plans, and writing maintenance plans — is defined but not yet implemented; the relevant ISA-95 input/output tables have been identified. The Node-RED collector will be adapted to the IoT services of each plant, since the communication protocol depends on the local system integration.
APIs & Interfaces
Section titled “APIs & Interfaces”The FastAPI backend exposes RESTful endpoints covering:
- Machine management: register, list and delete machines, plus a unified health/status endpoint
- Sensor management: register or remove sensors and list the sensors mapped to a machine
- Rules: create and delete physical limit rules (alarm thresholds) per sensor
- Model parameters: read and update TiRex hyperparameters (prediction window, context window, resample time)
- Data access: historical telemetry, latest forecasts and real-time statistics
- Alarms: retrieve active alarms and acknowledge them
The React UI offers a plant dashboard (machine health overview and filterable alarm table), an analysis screen with the Machine Health Index (MHI), SPC indicators, degradation metrics and prediction-versus-actual charts, and configuration screens for machines, transformer hyperparameters and sensor rules.
User Interface
Section titled “User Interface”Representative screens of the PMT web interface in the first release:
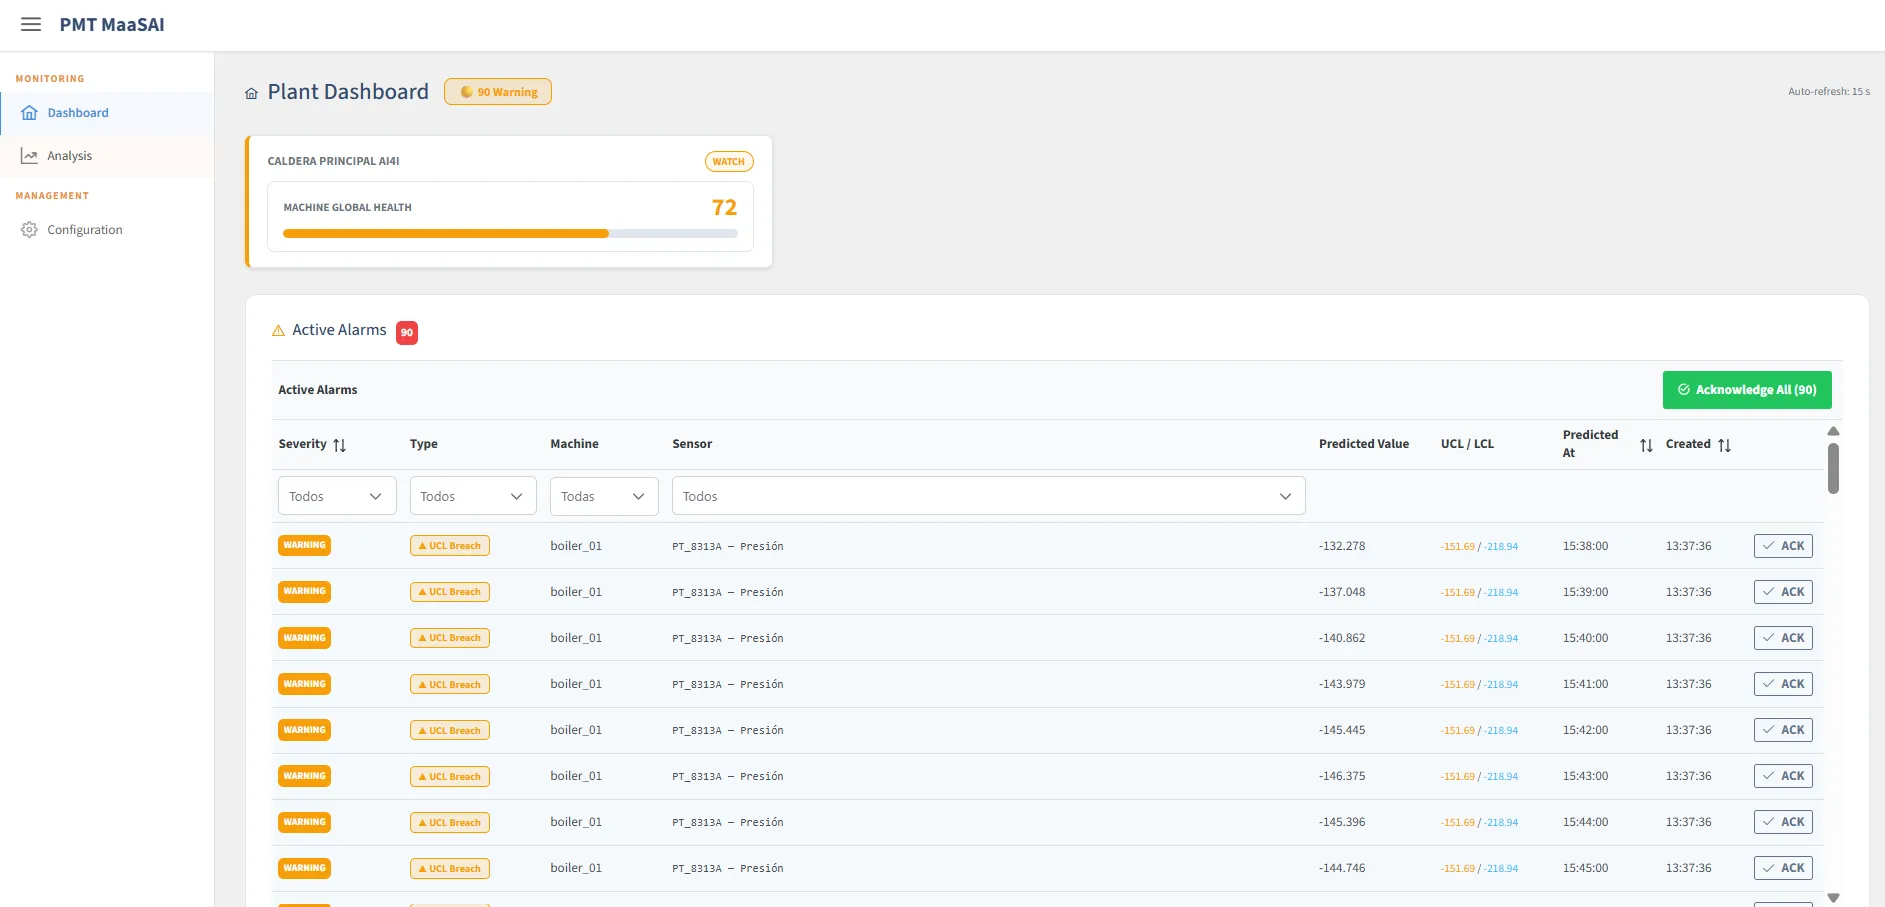
General plant and alarms screen — MaaSAI deliverable D12.1.
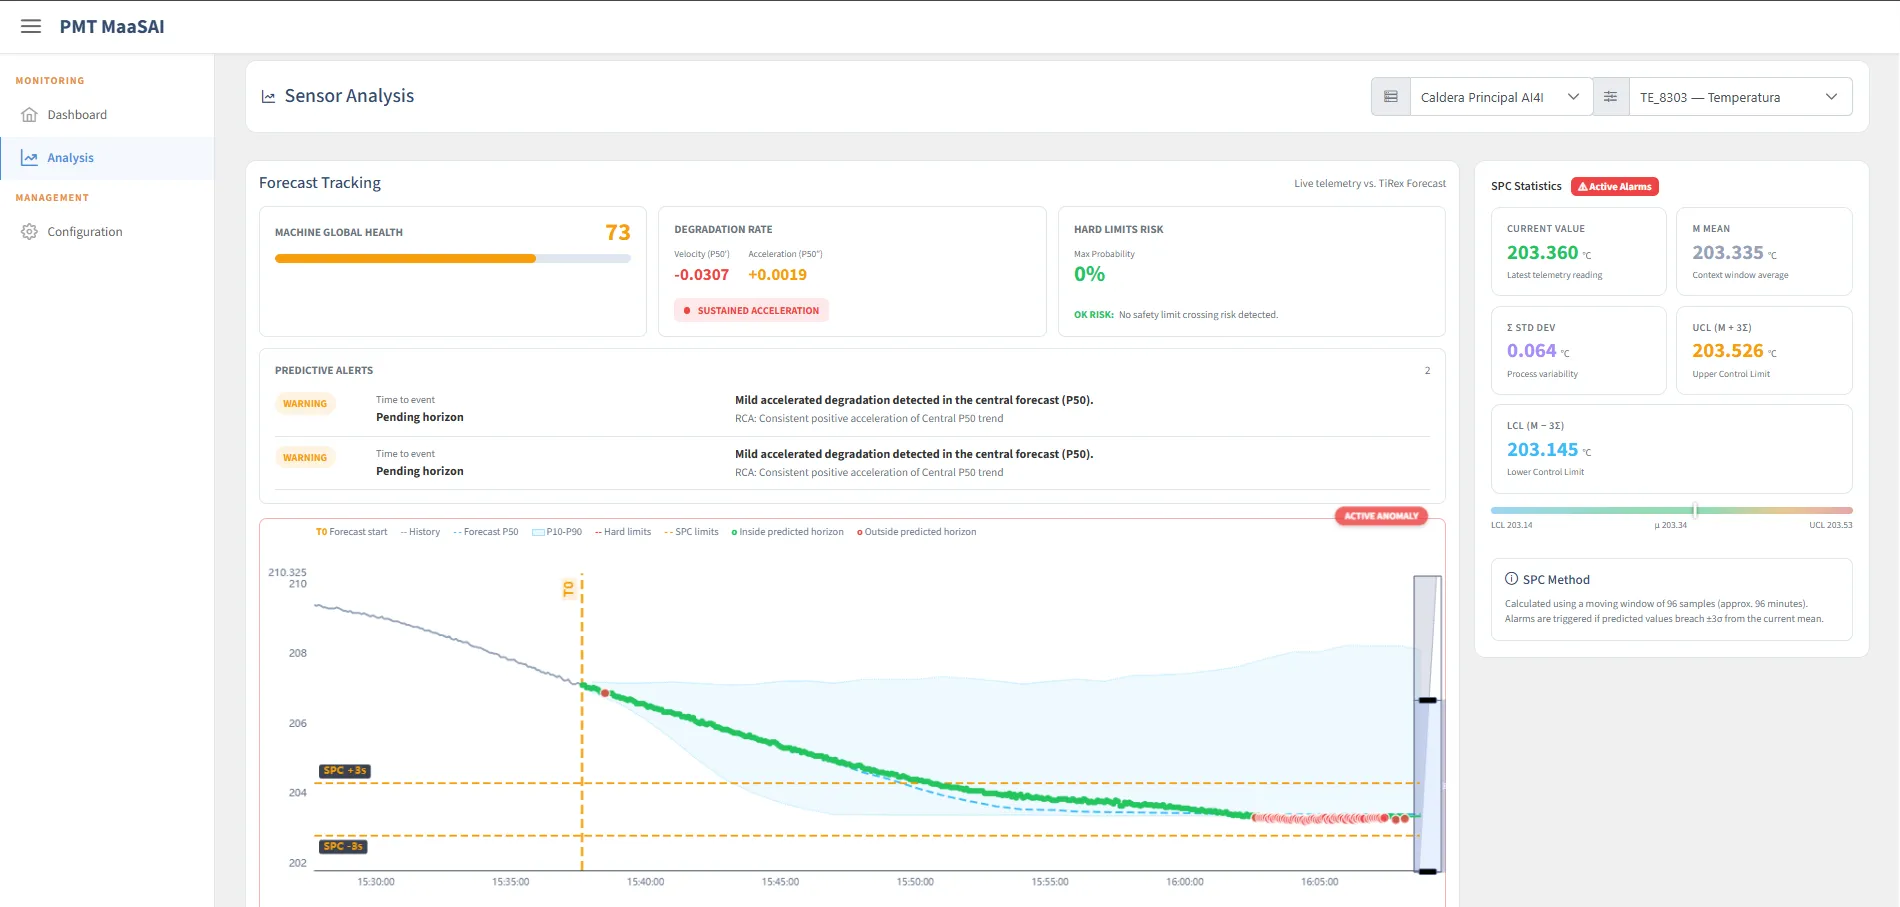
Sensor and machine analysis screen — MaaSAI deliverable D12.1.
Deployment & Configuration
Section titled “Deployment & Configuration”The PMT is a fully containerised multi-tier microservice architecture with four components: React frontend, FastAPI backend under Uvicorn, TimescaleDB database and Node-RED ingestion tool. Inference requires moderate resources:
| Requirement | Minimum | Recommended |
|---|---|---|
| CPU | 2 vCPU | 4+ vCPU |
| RAM | 4 GB | 8–16 GB |
| Storage | 20 GB | 50+ GB SSD |
| OS | 64-bit Linux or Windows Server 2022 | 64-bit Linux |
Key configuration parameters are the per-machine transformer hyperparameters and per-sensor operating limits, criticality levels and statistical settings.